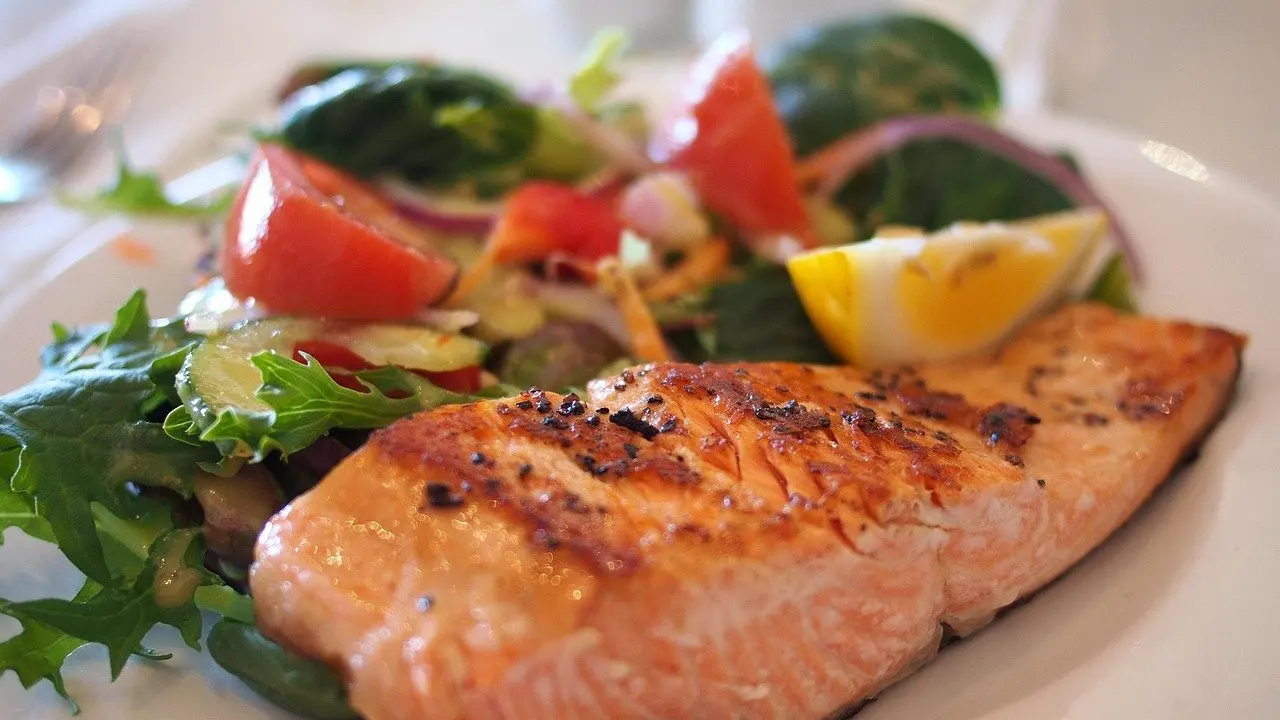
Does salmon have mercury? Yes, but at low levels: FDA monitoring puts fresh and frozen salmon at a mean of 0.022 ppm, against 0.979 ppm for shark. FDA’s figures do not split wild from farmed, so choose between them on other grounds.
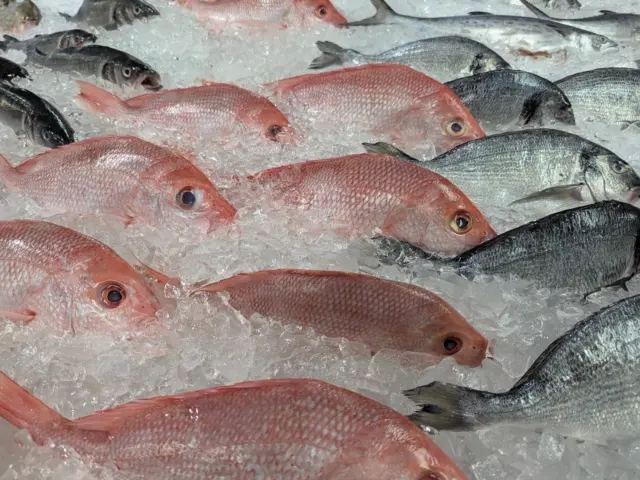
Picture a fish counter with wild fillets on one tray and farmed on the next, and a label that says nothing about mercury. For mercury alone, the monitoring data give no basis for ranking one tray above the other. Omega-3 content and other contaminants are where the two differ. For the wider species ranking, see the mercury in fish chart in our fish and seafood guide.
Criteria for choosing between wild and farmed salmon
Work through these checks in order. The first settles whether salmon is a sensible fish to eat at all, and the rest decide which kind suits you.
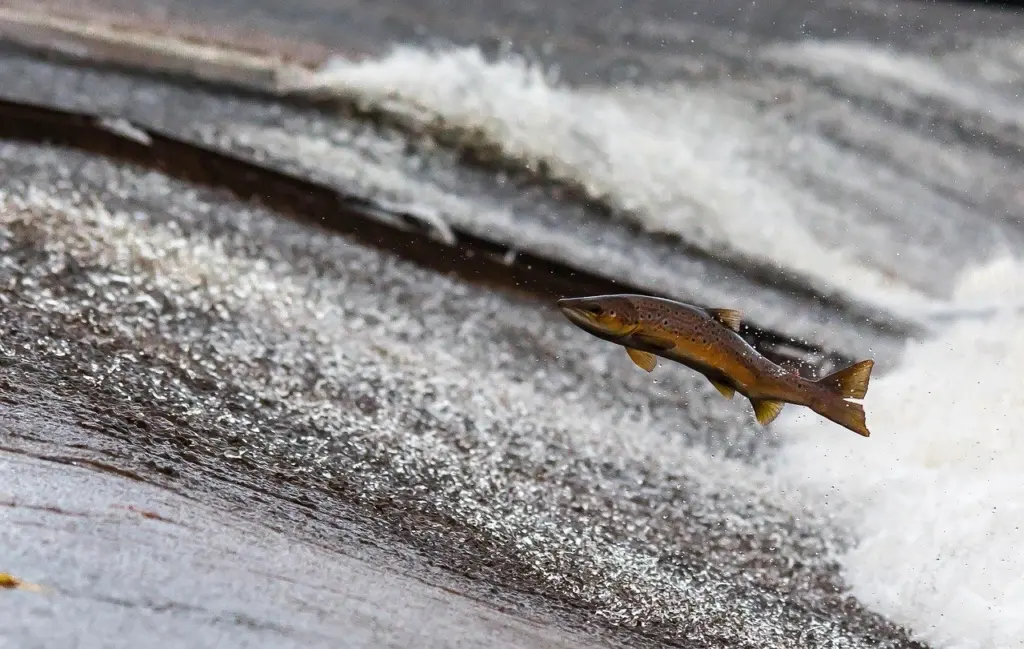
- Check the mercury level for salmon as a whole. FDA’s salmon averages are low next to high-mercury fish (the table below shows the figures). Mercury builds up as larger fish eat many smaller fish, according to Cleveland Clinic, which is why large predators sit at the top of mercury charts and salmon does not.
- Ask whether the data can separate wild from farmed. It cannot. The USDA National Agricultural Library notes that FDA’s mercury data do not provide the size or age of the fish or the locations where they were grown. A claim that one type is clearly lower in mercury therefore has no support in that dataset.
- Compare omega-3 content. Salmon is one of very few species that supplies EPA and DHA at the recommended intake rate. In farmed fish, nutrient levels can vary dramatically with the fatty acids in the feed.
- Weigh other contaminants. PCBs and dioxins are where wild and farmed fillets are argued over, and this is the point on which the two actually differ.
- Set a sensible weekly amount. Weekly intake is covered in its own section below.
Mercury in salmon compared with other fish
Salmon sits at the low end of FDA’s commercial fish monitoring. Shark is included here as a high-mercury reference point.
| Fish | Mean (ppm) | Median (ppm) | Highest reading (ppm) | Samples | Planning use |
|---|---|---|---|---|---|
| Salmon, fresh or frozen (1991-2009) | 0.022 | 0.015 | 0.19 | 94 | Typical salmon fillets, wild or farmed, are a low-mercury choice |
| Salmon, canned (1993-2009) | 0.014 | 0.010 | 0.086 | 19 | A convenient option with a slightly lower average than fresh |
| Shark (1991-2007) | 0.979 | 0.811 | 4.54 | 356 | A reference for how far higher the top of the range goes |
These figures come from FDA’s mercury levels in commercial fish and shellfish table, which reports concentrations in parts per million.
The highest single salmon reading, 0.19 ppm, is still well under shark’s average of 0.979 ppm. FDA also flags readings it labels ND, meaning the mercury was below its detection level of 0.01 ppm. Some salmon samples therefore contained too little mercury to measure with that method.
Canned salmon follows the same pattern, with a mean of 0.014 ppm across 19 samples. Salmon also compares well with the fish many people eat most often. The USDA National Agricultural Library describes salmon as lower in mercury and PCBs than most canned tuna products, so it is the better swap if canned tuna is your usual lunch.
Wild versus farmed salmon side by side
Mercury is the one criterion where the evidence cannot pick a winner. The differences that do exist concern omega-3 content and PCBs, and both trace back to what the fish eat.
| Criterion | Wild salmon | Farmed salmon | Planning use |
|---|---|---|---|
| Mercury | Included in FDA’s combined salmon average | Included in FDA’s combined salmon average | Do not choose between them on mercury |
| Omega-3 | Salmon as a species reaches the EPA and DHA target at the recommended intake | Varies with feed composition; the industry describes levels as high | Ask the seller about feed if omega-3 is your main reason for buying |
| PCBs and dioxins | Industry statement says levels are higher than in farmed fish | Industry statement says levels are lower; 2004 PCB contamination was linked to fish oil in feed | Treat the industry claim as a claim, not settled data |
| Feed | Not applicable | Shift toward vegetable ingredients and away from marine ingredients such as fish oil | Feed changes can alter both omega-3 and contaminant profile |
The omega-3 and PCB rows draw on the USDA National Agricultural Library summary and a Global Salmon Initiative article from the farming industry.
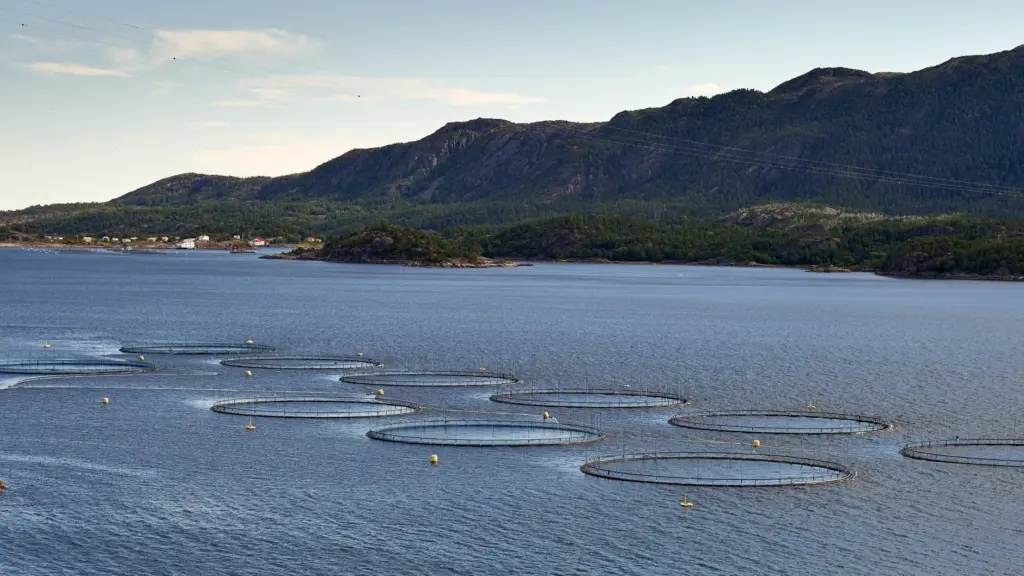
The industry source states that studies show farmed salmon are lower in PCBs and dioxins than wild varieties. It is a producer statement without numbers, so it is a reason to look further rather than a ranking. The same source says farmed diets now use more vegetable ingredients and less fish oil.
The PCB history shows why feed matters. The USDA National Agricultural Library reports that PCBs found in farmed salmon in 2004 were unintentionally added with the fish oil in feed, and that producers later changed feed composition. That shift has a trade-off: omega-3 concentrations in farmed fish depend on the fatty acids in the feed, so less fish oil can change the omega-3 profile.
Who should choose which
- Choose either if mercury is your only worry. Salmon appears on the FDA best-choice list alongside herring, pollock, sardines, tilapia and trout, as summarised by Cleveland Clinic. Both wild and farmed fillets fall within the salmon figures above.
- Lean wild if you want to avoid feed-driven variation. Farmed omega-3 levels depend on the feed formula, so wild salmon removes that variable. The wild-versus-farmed PCB comparison still rests on an industry claim.
- Lean farmed if PCBs and dioxins are your concern. The industry statement favours farmed fish on this point, and the PCB problem traced to feed has been addressed by producers changing feed composition. Ask your retailer about the feed used.
- Choose canned salmon for convenience and a low average. Canned salmon has a mean of 0.014 ppm, and the pack does not separate its mercury by wild or farmed origin either.
How much salmon per week
The supplied evidence sets no mercury-based weekly cap for salmon, so the usable benchmark is the general fish recommendation. The Dietary Guidelines Advisory Committee recommended in 2004 that adults eat 8 ounces of fish every week, per the USDA National Agricultural Library. The same page names salmon among the few species (with herring, mackerel, sablefish, shad and whitefish) that provide EPA and DHA at that rate.
That makes salmon an efficient way to meet the fish target without drifting into higher-mercury species. A maximum from the data, such as the 0.19 ppm top reading, is a ceiling for the salmon sampled, not a target to aim for. People with particular medical circumstances should follow their own clinician’s advice.
Raw salmon on a menu raises its own ordering questions, covered in our guide to mercury in sushi. Freshwater catches are a separate matter: is lake fish safe to eat mercury depends on local advisories, which that guide explains.
Frequently asked questions
| Question | Answer |
|---|---|
| Is canned salmon lower in mercury than fresh? | FDA’s canned salmon mean is 0.014 ppm against 0.022 ppm for fresh or frozen, so canned averages slightly lower. Both are far below shark at 0.979 ppm. |
| Is salmon better than canned tuna for mercury? | Yes. The USDA National Agricultural Library describes salmon as lower in mercury and PCBs than most canned tuna products, and as providing higher amounts of healthy fats. |
| What does ND mean in FDA’s mercury table? | ND marks a sample with mercury below the detection level of 0.01 ppm, so it was too low to measure. |
| Why does omega-3 differ between farmed salmon? | Farmed fish take on the fatty acids in their feed, so omega-3 content varies with the feed formula. |
| Was the PCB problem in farmed salmon fixed? | PCBs reported in farmed salmon in 2004 were linked to fish oil in feed. Producers later changed feed composition, which the USDA National Agricultural Library dates to 2008. |